Explored ggplot2 and bioinformatics packages. Learned basic R fundamentals such as syntax and debugging.
Understanding how to read scientific papers.
Tools:
STEM-Away, RStudio, R
Soft Skills:
Project management- learning how to effectively manage a team using different resources like Trello and Slack
Technical Presentation- I created powerpoints for each team meeting to help direct the overall team discussion.
Leadership and Mentoring- My co-lead and project manager had meetings to decide the best resources for managing the team. I also mentored students one-on-one when they had trouble with accessing their mentor chains accounts or with downloading R studio.
Achievement Highlights:
I was able to download Rv4.0.0, RStudio, and the ggplot2 and Bioconductor packages.
I was able to navigate R.
I was able to get a basic understanding of bioinformatics and reading scientific papers.
I was able to effectively manage a team and mentor students one-on-one.
Difficulties Completing Tasks:
*At first, I had problems navigating the STEM-away website and finding posts on the forum, but I feel confident in navigating the website now.
Downloaded dataset from GEO database and loaded data into R.
Acquired metadata and explored batch correction.
Loaded all Bioconductor packages and Shiny package installation
Learned how to navigate Github and create repositories for team
Designed an Rshiny app that took the user’s blood pressure measurements and notified the user of the meaning behind their blood pressure measurement.
Started module 3 by normalizing the data with mas5() and creating the boxplot.
Tools:
R, GEO Database, Slack
Soft Skills:
Time Management
Project Management
Leadership and Mentoring
Collaboration
Achievement Highlights
Took metadata from GEO database and imported metadata into R.
Normalized the data and created a boxplot.
Designed a functional Rshiny app that tracked blood pressure readings.
Difficulties Completing Tasks:
Figuring out the syntax for the different cases I created for my RShiny app was difficult, but after reading the R textbook I was able to create a functional app.
I had difficulty with the Bioconductor packages, but once I updated R to the latest version I was able to resolve this.
Used the dataset GSE to create a normalized and background-corrected boxplot with both Mas(5) and RMA
Performed background correction and normalization using both mas(5) and RMA so we could see the differences between them
Tools:
R, GEO Database, Slack, Github
Soft Skills:
Time Management
Project Management
Leadership and Mentoring
Collaboration
Achievement Highlights
Learned the math behind both mas(5) and RMA in Anya’s meeting.
Work in a team to create the boxplot, and verified that it was similar to the figure from the paper.
Created github repositories so that our team can post their code on there as their weekly deliverable.
Created meeting powerpoints to keep members on track with deliverables, and presented my the results of the boxplot code to my team.
Difficulties Completing Tasks:
At first, I didn’t understand the concept behind normalization/background correction but attending Anya’s office hours and kickoff meeting helped me to understand these concepts.
The simpleaffy and arrayQualityMetrics libraries didn’t work for me because of their dependency on other packages, but after getting guidance from Samuel I was able to resolve this.
Time Management: I’ve especially learned how to manage my time effectively this week because I am working as a project lead for both my team and for group B2 (R shiny app project).
Project Management: I create powerpoints with the links to everything the group needs to complete the module for that week.
Leadership and Mentoring: The group sends in questions on a google form now, and I attend lead office hours to get their questions answered. Then we go over what I learned from the lead office hours in our regular meetings.
Collaboration: We now have socials every week to help the team members to get to know each other better.
Achievement Highlights:
Use information from the Bioinformatics Kickoff meetings with Anya to create the volcano plot and to create a presentation explaining the meaning behind the volcano plot (for example, I explained that in a volcano plot, the most upregulated genes are towards the right, the most downregulated genes are towards the left, and the most statistically significant genes are towards the top).
Compared the results to that of the paper and identified outliers to modify the dataset.
Details of Tasks and Hurdles:
I was able to create the volcano plot, but after attending office hours Anya suggested that instead of displaying the probe ID’s that I try to display the gene symbols which will give a better meaning to the plot. I really struggling with getting the volcano plot to display the gene symbols instead of the probe ID’s, but after discussing this with my group member Shravya I was able to resolve this.
Created 3 bar plots representing enriched gene ontology terms for cellular components, biological processes, and molecular functions of up-regulated DEG.
Tools:
org.Hs.eg.db
clusterProfiler
enrichplot
msigdb
GEO Database, Slack, Github
Soft Skills:
Project Management: I create powerpoints with the links to everything the group needs to complete the module for that week.
Leadership and Mentoring: I went to Anya’s office hours to get answers to the group’s questions, and then I relay Anya’s guidance to the team.
Collaboration: Shreya and I worked on our part of module 5 together.
Achievement Highlights:
Use information from the Bioinformatics Kickoff meetings with Anya to create the three plots and explain the meaning behind them. (For example, we explained that there are three different categories of gene ontology: biological processes (BP) which are pathways and larger processes that involve multiple gene products’ activity, molecular function which are molecular activities of gene products, and cellular components are where the gene products are active).
Roman and I also organize a meeting with the UX/UI team this week. We divided the team into 5 subgroups to each create a layout. I also designed my own layout. We learned how important it is to consider the user’s skill level when making a layout.
Details of Tasks and Hurdles:
Shreya and I had some initial difficulty in completing this module as we didn’t understand how to generate the DEG vector and what threshold level we should use to filter out the lower DEGs. However, after consulting Anya, we were able to resolve this.
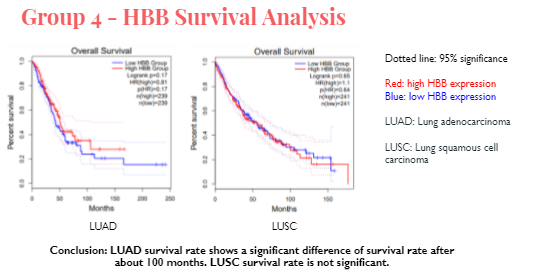
Used GEPIA (Gene Expression Profiling Interactive Analysis) to conduct survival analysis on the HBB (hemoglobin subunit beta) gene.
Tools:
GEPIA
Literature articles on HBB gene, Slack, Github
Soft Skills:
Leadership and Mentoring: We are in the process of organizing members on the team who will be participating in the capstone project or in the Rshiny app project.
Collaboration: Ivan, Kelly, and I worked on running survival analysis on three different genes (AGER, NCKAP5, and HBB respectively) using GEPIA.
Achievement Highlights:
Compared the survival rate of all cancer types to the survival rate of lung adenocarcinoma (LUAD) and lung squamous cell carcinoma (LUSC) together. This indicated that in the presence of HBB, there was a higher survival rate.
Next, I compared just LUAD to LUSC individually. The survival rate for LUAD in the presence of HBB shows that there is a significant difference in the survival rate after about 100 months. Therefore, this indicates that lung adenocarcinoma is affected in the absence of HBB. On the other hand, the LUSC survival rate was not as significant. This does make sense because I was able to find several articles that showed that hemoglobin subunit beta played an important role in lung cancer metastasis. For example, I found that elevated expression of HBB was detected in circulating tumor cells, but when HBB expression was decreased this inhibited lung cancer metastasis. Therefore, more research needs to be done on determining if hemoglobin subunit beta can be used to prevent lung cancer and increase survival rates.
Group B2 finished their final figma layout.
Details of Tasks and Hurdles:
At first, I was not sure what gene to analyze using GEPIA. However, after doing a literature background research, I selected the HBB gene because I found articles detailing that elevated expression of HBB was detected in circulating tumor cells, but when HBB expression was decreased this inhibited lung cancer metastasis.
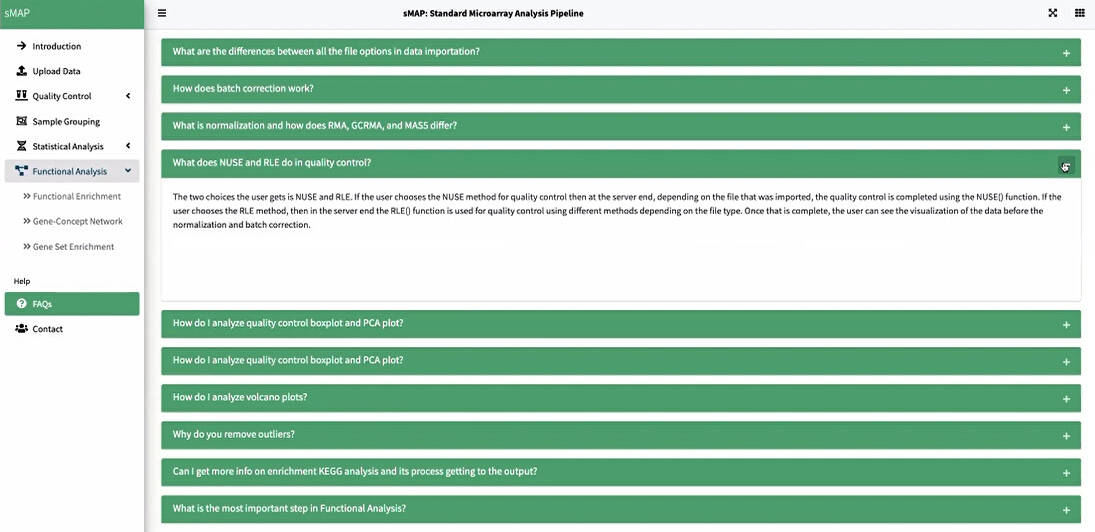
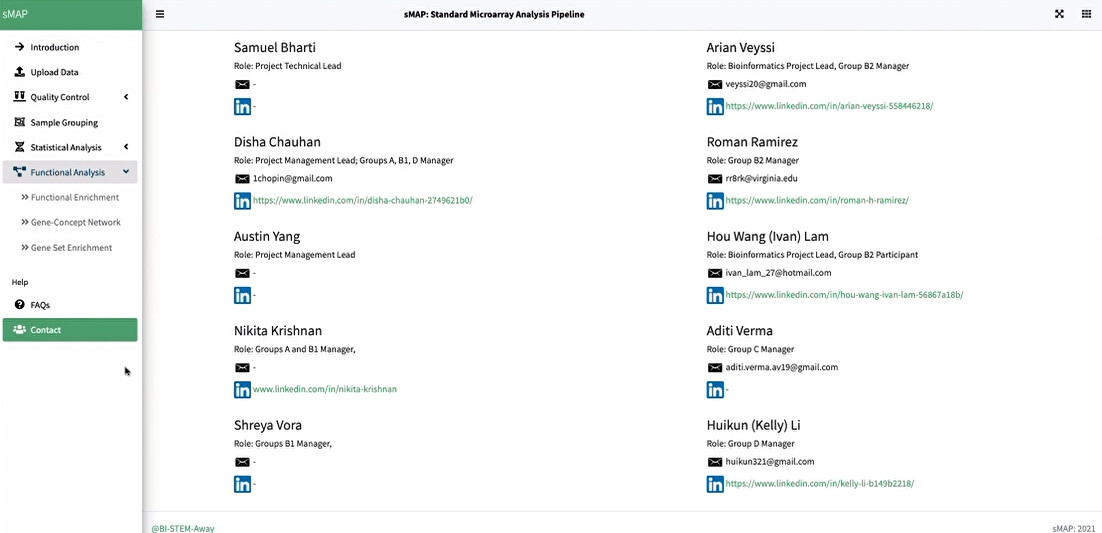
Designed the layout of the app first with figma. Then used R, bs4dash, and HTML to code the layout, specifically designing the contact page, FAQs, and feedback pages.
Wrote app tutorials to guide the user through a step by step process.
Conducted literature research for capstone presentation.
Prepared for slides for capstone presentation and for Rshiny app presentation.
Tools:
Figma
bs4dash
Stack overflow
Github
Soft Skills:
Leadership and Mentoring: Guided group B2 in designing the layout by assigning tasks to team members.
Collaboration: Roman, Ivan, and I had extensive meetings to work on the app’s layout. I also meet with Aditi to work on the app’s tutorial.
Achievement HIghlights:
Designed the import data feature with figma.
Designing the app’s layout along with Roman and Ivan.
I also worked on designing the FAQ’s layout by designing collapsible boxes for each question and answer. The actual questions and answers will be written when the documentation is finished.
One problem that I ran into is that I wasn’t able to make the stored data private so that the user wouldn’t be able to see previous responses. However, after reading multiple sources it seems that the authentication feature is only available on a paid version of Shinyapps.io.
I also wrote the app’s tutorial along with Aditi. The following our first draft of the tutorial.
Tutorial.pdf (1.3 MB)